
The Definitive Guide to Quantitative UX Research
Updated on
Published on
The success or failure of a digital product now hinges directly on the depth of a team’s user understanding. For building products that are both effective and enjoyable, creators must move past guesswork and rely on objective data. This need is directly addressed by quantitative UX research. It’s a systematic approach to understanding user behavior through numerical data, providing a powerful lens through which to evaluate and improve the user experience.
At WriteMyEssay, we’ve compiled this in-depth guide to help you navigate the world of quantitative user research. We’ll analyze the most effective methods, explore the nuances of data analysis, and show you how to leverage quantitative insights to create products that truly resonate with your audience. Whether you’re a seasoned UX professional or just starting your journey, this guide will provide you with the knowledge and tools you need to succeed.

Core Quantitative UX Research Methods
Quantitative user research methods are a set of techniques used to gather and analyze numerical data about user behavior, attitudes, and preferences. Unlike qualitative research, which focuses on the “why” behind user actions, quantitative research is all about the “what,” “how many,” and “how often.” It provides a statistical basis for design decisions, helping you to identify trends, measure the impact of changes, and build a strong case for your design choices.
Below, we will examine several of the most widely used and impactful methods in quantitative UX research. From analyzing website traffic to measuring user satisfaction, these quantitative testing methods will empower you to make informed decisions and create a truly user-centered product.
Leveraging Web Analytics for User Insights
Web analytics tools, such as Google Analytics, provide a rich and detailed dataset on how users interact with your website or application. These tools yield extensive numerical data that helps you grasp user actions, pinpoint frustrations, and discover areas for enhancement.
Web analytics allows you to monitor several crucial metrics, such as:
- Pageviews: Represents all page impressions on your site.
- Unique Visitors: Counts each individual person who visits.
- Bounce Rate: Shows the proportion of single-page visits where the user leaves without interacting.
- Conversion Rate: Measures how many users complete a specific goal, like a purchase or signup.
- Session Duration: Calculates the typical length of a user’s visit.
Reviewing this data gives you clearer insights into user engagement and highlights specific opportunities to refine the user experience. For those looking to delve deeper into data analysis and presentation, crafting a detailed essay on user behavior trends can be a valuable exercise. For students and professionals alike, seeking a professional essay writing service can offer a structured approach to articulating these complex findings.
Conducting Quantitative Usability Testing
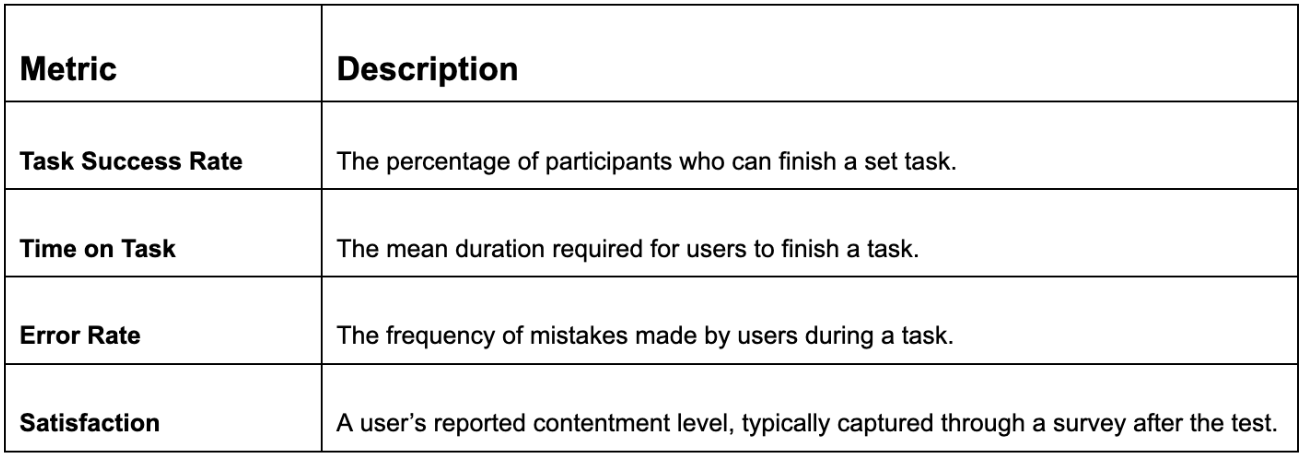
Through quantitative usability testing, you can assess a product’s ease of use by recording numerical data on how users perform specific tasks. It’s a powerful way to get objective data on how easy your product is to use and to identify specific areas where users are struggling. Writing a comprehensive essay on the results of such a quantitative usability study can help to synthesize the findings and present them to stakeholders. It is important that this essay is well-structured.
The following table details several key metrics frequently employed in quantitative usability testing methods:
Organizing Information with Card Sorting
Card sorting helps researchers learn how people mentally organize information. This technique is crucial for creating logical navigation systems. During the exercise, users are handed cards representing content or features and are asked to sort them into logical piles.
Card sorting is generally conducted in three primary formats:
- Open Card Sorting: Users sort cards into groups and name the groups themselves.
- Closed Card Sorting: Users sort cards into predetermined, named groups.
- Hybrid Card Sorting: Users sort cards into some preset groups but can also create new ones.
Optimizing Design with A/B and Multivariate Testing
To determine the best-performing design, researchers use A/B and multivariate testing. A/B testing involves comparing two variants by showing each to a separate user group and measuring which is more effective. Multivariate testing expands on this by testing multiple component changes simultaneously to find the optimal combination of elements.
The main distinctions between A/B and multivariate testing are outlined in this table:

Navigating with Tree Testing
Tree testing is a technique used to assess how easily users can locate information within a site’s structure. It’s a great way to test the effectiveness of your information architecture and to identify any areas where users are getting lost. In a tree test, participants are given a “tree,” which is a text-only version of your site’s navigation, and are asked to find specific pieces of information.
Measuring First Impressions with Desirability Studies
Desirability studies are a way to measure the emotional response that users have to a design. In a desirability study, participants are shown a design and are asked to choose from a list of adjectives that they feel best describe it. This can help you to understand whether your design is communicating the right message and to identify any areas where it might be falling short.
The following list includes typical descriptive words presented in desirability studies:
- Appealing
- Attractive
- Calm
- Clean
- Complicated
- Confusing
- Credible
- Cutting-edge
- Easy to use
- Exciting
- Familiar
- Fresh
- Innovative
- Intimidating
- Old
- Professional
- Simple
- Trustworthy
- Unprofessional
Uncovering Patterns by Clustering Qualitative Comments
While qualitative comments may seem subjective, they can be turned into quantitative data through a process called clustering. This involves grouping similar comments together to identify patterns and themes. For example, you could cluster all of the comments that mention a specific feature or a particular pain point. This can help you to quantify the frequency of different issues and to prioritize which ones to address first.
Qualitative vs Quantitative UX Research: A Comparative Look
While both quantitative and qualitative research are valuable, they serve different purposes. This table illustrates the primary distinctions between the two approaches:

The most effective UX research strategies often involve a combination of both quantitative and qualitative methods. By using a mixed-methods approach, you can get a more complete picture of the user experience and make more informed design decisions.

Conclusion: The Future of Data-Driven Design
As the discipline of product design matures, quantitative UX research has become a foundational component of the process. By leveraging the power of data, you can gain a deeper understanding of your users, make more informed design decisions, and create products that are not only beautiful and functional but also truly delightful to use.
The methods we’ve discussed in this guide are just the starting point. As you continue to grow and learn as a UX professional, you’ll discover new and innovative ways to use data to improve the user experience. The key is to stay curious, to always be learning, and to never stop putting your users at the center of everything you do.
.png "Best Branding Agencies in Toronto (2026)")
%20(1).png "10 Best Web Design Companies in Toronto (2026)")


