Lists of the most advertised brands in the world can look more precise than the underlying data allows. Companies do not all disclose the same thing: one may report advertising expense, another advertising and promotion, another broader brand and marketing investment, while third-party rankings may estimate media spend or score campaign effectiveness. Media owners such as Amazon also report advertising revenue, which is money they earn from advertisers, not money they spend on their own campaigns.
So this is not a definitive one-to-ten global ranking. It is a set of large, highly visible advertisers and brand groups, with recent public disclosures used where the accounting definitions are clear. For a separate ranking-style view using its own methodology, see Brand Vision’s 2025 advertising-spend overview.
At a glance
- P&G reported $9.2 billion in advertising costs for fiscal 2025, covering television, print, radio, digital, and in-store advertising (P&G 2025 10-K).
- Amazon reported $23.5 billion in advertising and promotional costs in 2025, while its advertising-services revenue reached $68.6 billion, showing why buyer and seller figures must be separated (Amazon 2025 10-K).
- L’Oréal reported €14.18 billion in advertising and promotion expense in 2025, equal to 32.2% of sales (L’Oréal 2025 results).
- Unilever reported €8.14 billion in brand and marketing investment in 2025, a broader measure than advertising alone (Unilever 2025 Annual Report).
- Coca-Cola reported $5.4 billion in advertising costs in 2025, while PepsiCo reported $3.4 billion in advertising expense and $5.4 billion in advertising and other marketing activities (Coca-Cola 2025 10-K) (PepsiCo 2025 10-K).
- Those figures are useful context, but they should not be ranked directly without accounting for different currencies, fiscal periods, definitions, and portfolio structures.
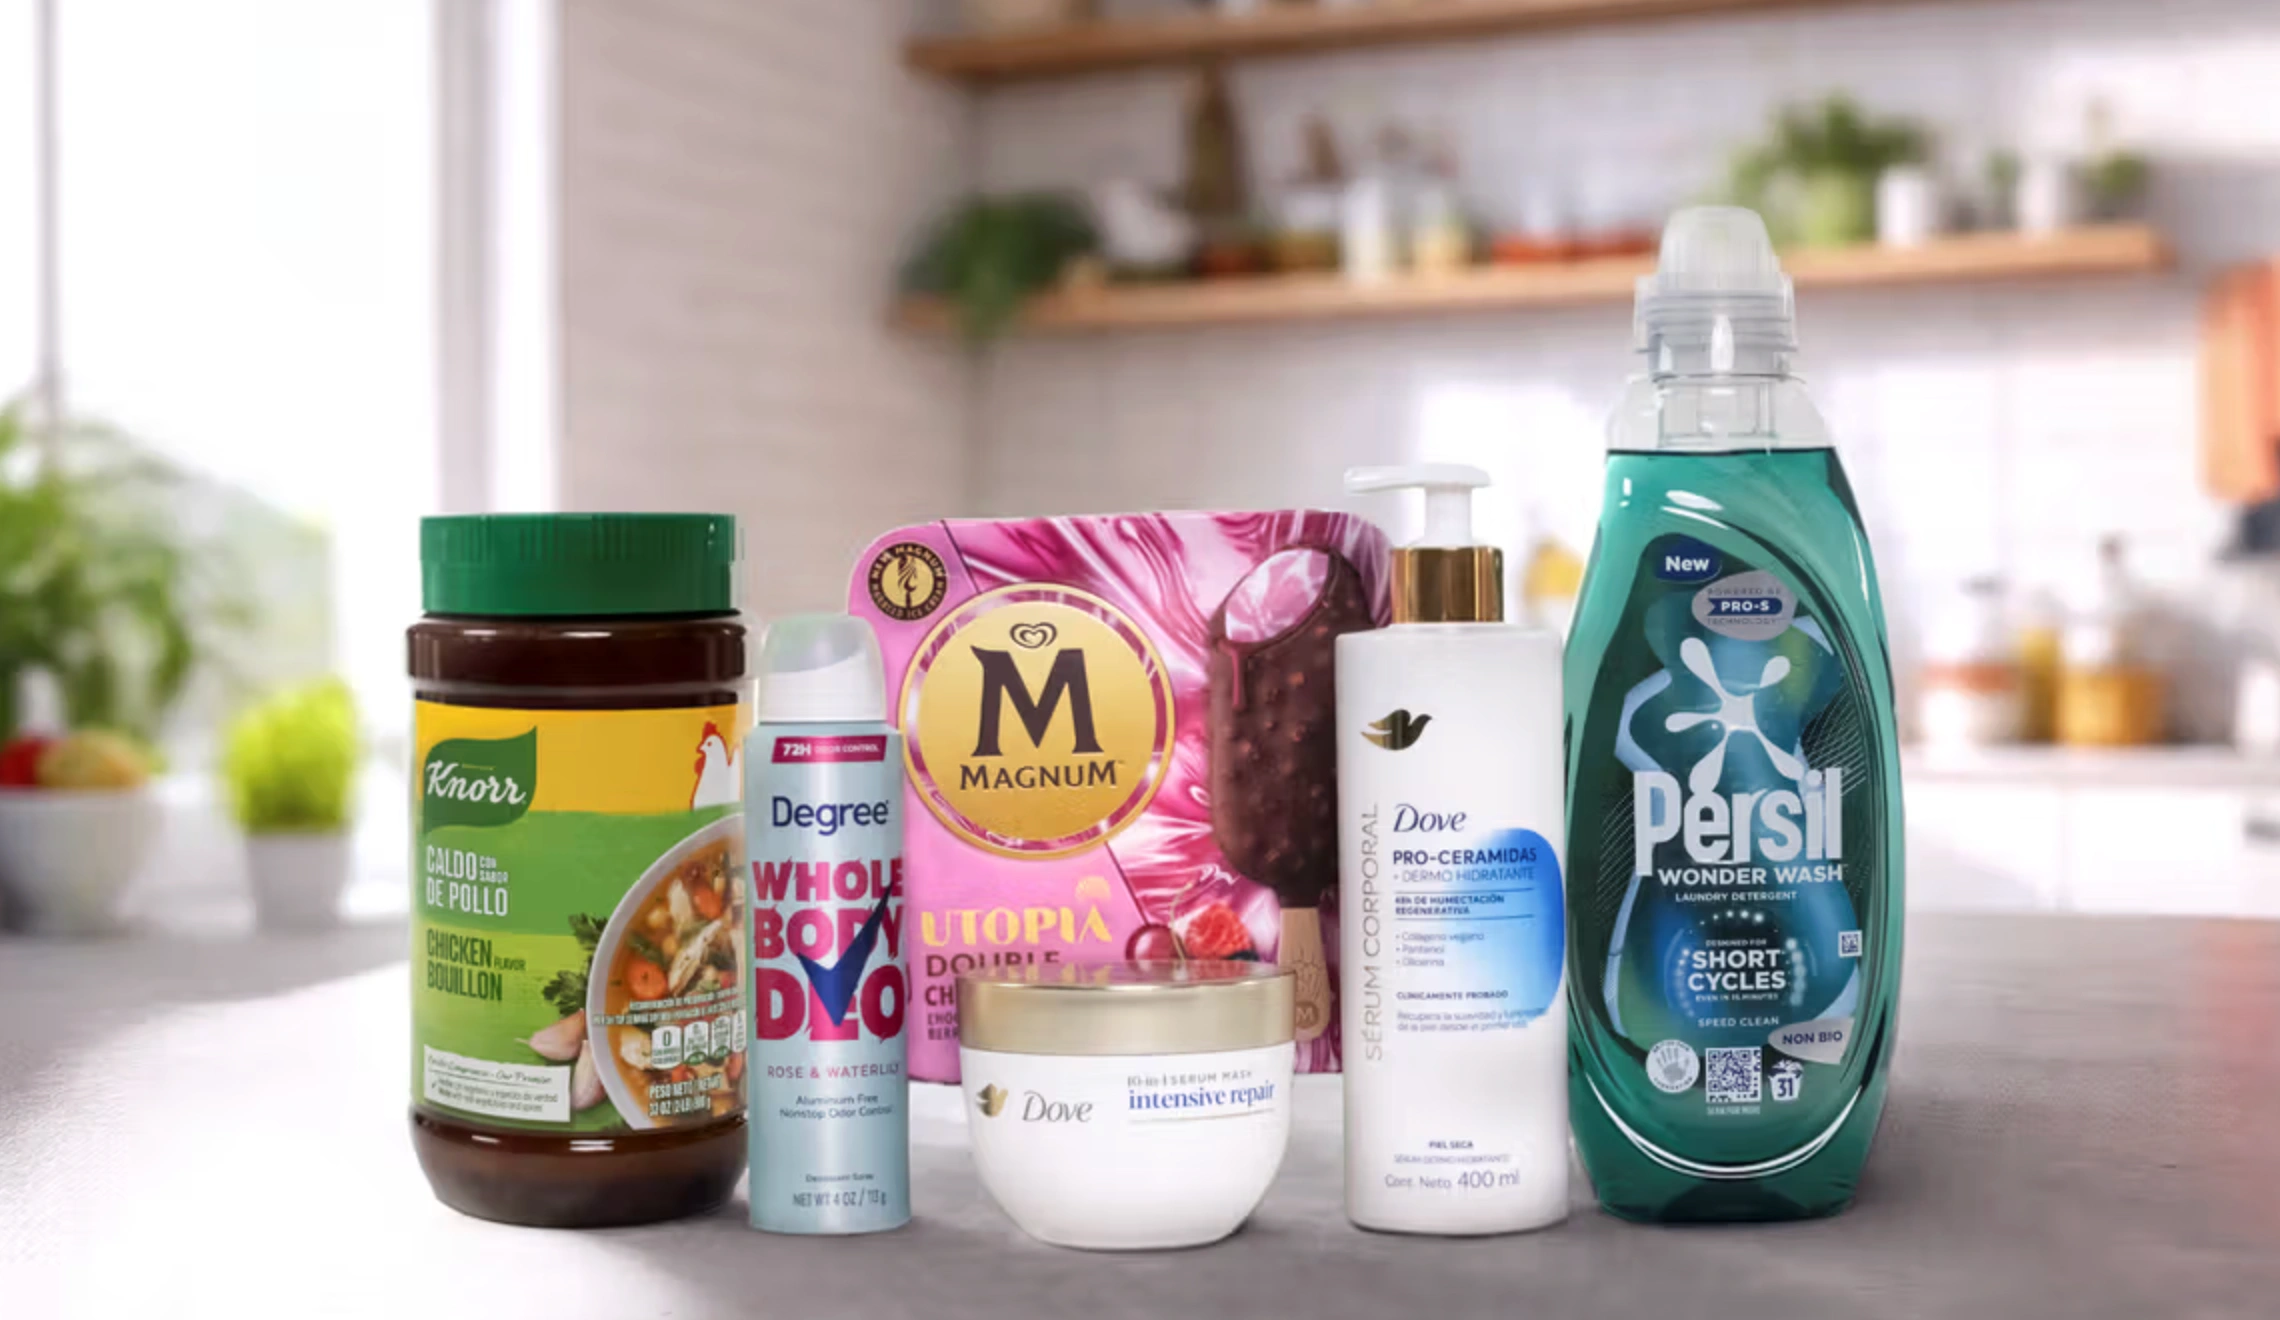
Procter & Gamble: portfolio scale and persistent advertising
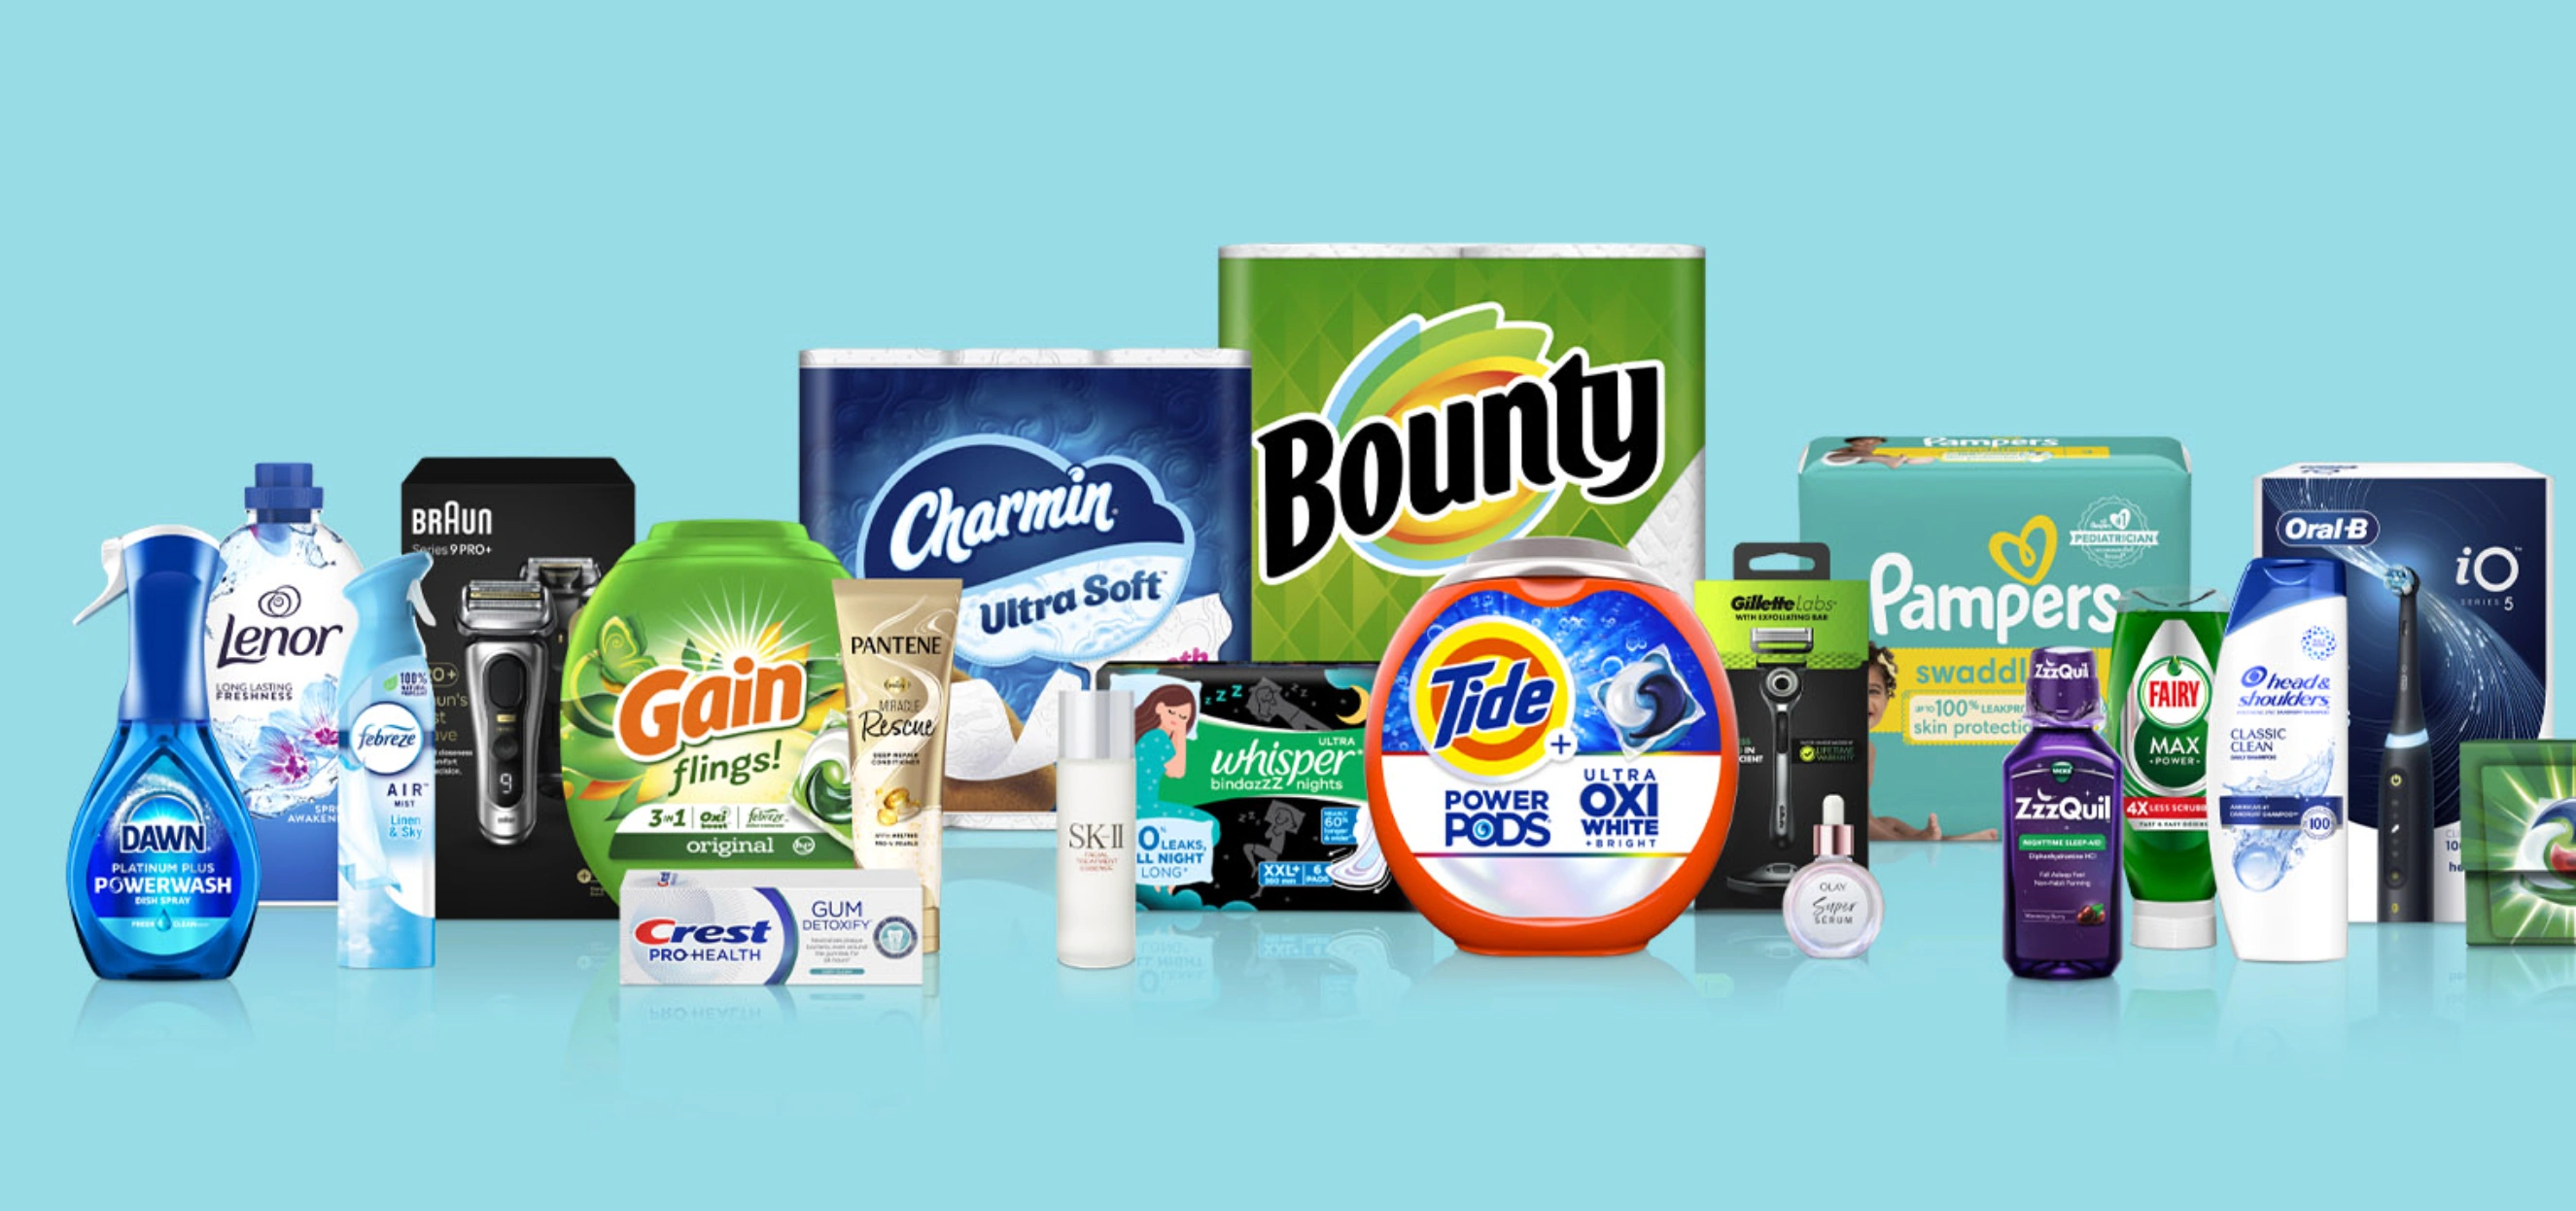
P&G is a useful benchmark for large-scale portfolio advertising because it supports brands across home care, beauty, grooming, baby care, health, and other frequently purchased categories. Its fiscal 2025 filing reported $9.2 billion in advertising expense, while the company has also described its approach as “consistent, persistent” advertising (WARC). That combination of category breadth and ongoing support helps explain why P&G appears so often in discussions of major global advertisers.
For marketers, the lesson is not simply to spend more. A large portfolio needs clear brand strategy so each brand has a defined audience, role, and message before media is scaled.
Amazon: a major advertiser and an even larger ad seller
Amazon is unusual because it operates on both sides of the advertising market. Its 2025 filing reported $23.5 billion in advertising and promotional costs used to market Amazon products and services. The same filing reported $68.6 billion in advertising-services revenue from sponsored ads, display, and video sold to advertisers. Those are different economic measures and should never be combined into one “ad spend” figure.
Prime Video adds another layer. A 2025 report cited 315 million monthly ad-supported viewers globally (Times of India). That audience figure helps explain Amazon’s media-owner scale, but it is not evidence of how much Amazon itself spends on advertising.
Unilever: large marketing investment, plus an effectiveness distinction
Unilever reported €8.14 billion in brand and marketing investment in 2025, equal to 16.1% of turnover. Its accounting definition includes costs related to building brand equity and awareness, so it is broader than a pure media-spend number. That makes it useful for understanding commitment to marketing, but not perfectly comparable with P&G’s narrower advertising-cost disclosure.
Unilever also appears prominently in WARC’s Media 100 (WARC Media 100: Unilever No.1 advertiser). That ranking measures award-winning media effectiveness and strategy. It is not a ranking of advertiser spend, which is why the two ideas should stay separate.
L’Oréal Group: advertising and promotion at beauty scale
L’Oréal provides one of the clearest current disclosures in this group. The company reported €14.18 billion in advertising and promotion expense for 2025, representing 32.2% of sales. That level of support reflects a portfolio with frequent launches, regional campaigns, retail partnerships, creators, and multiple beauty categories. Historical industry coverage also helps explain why L’Oréal has long appeared in conversations about major advertisers (Dentsu).
Beauty is also a strong example of B2C marketing where media, product novelty, retail availability, and creator influence have to work together. High spending alone does not solve weak positioning or a poor path to purchase.
Coca-Cola Company: enduring assets with large paid support
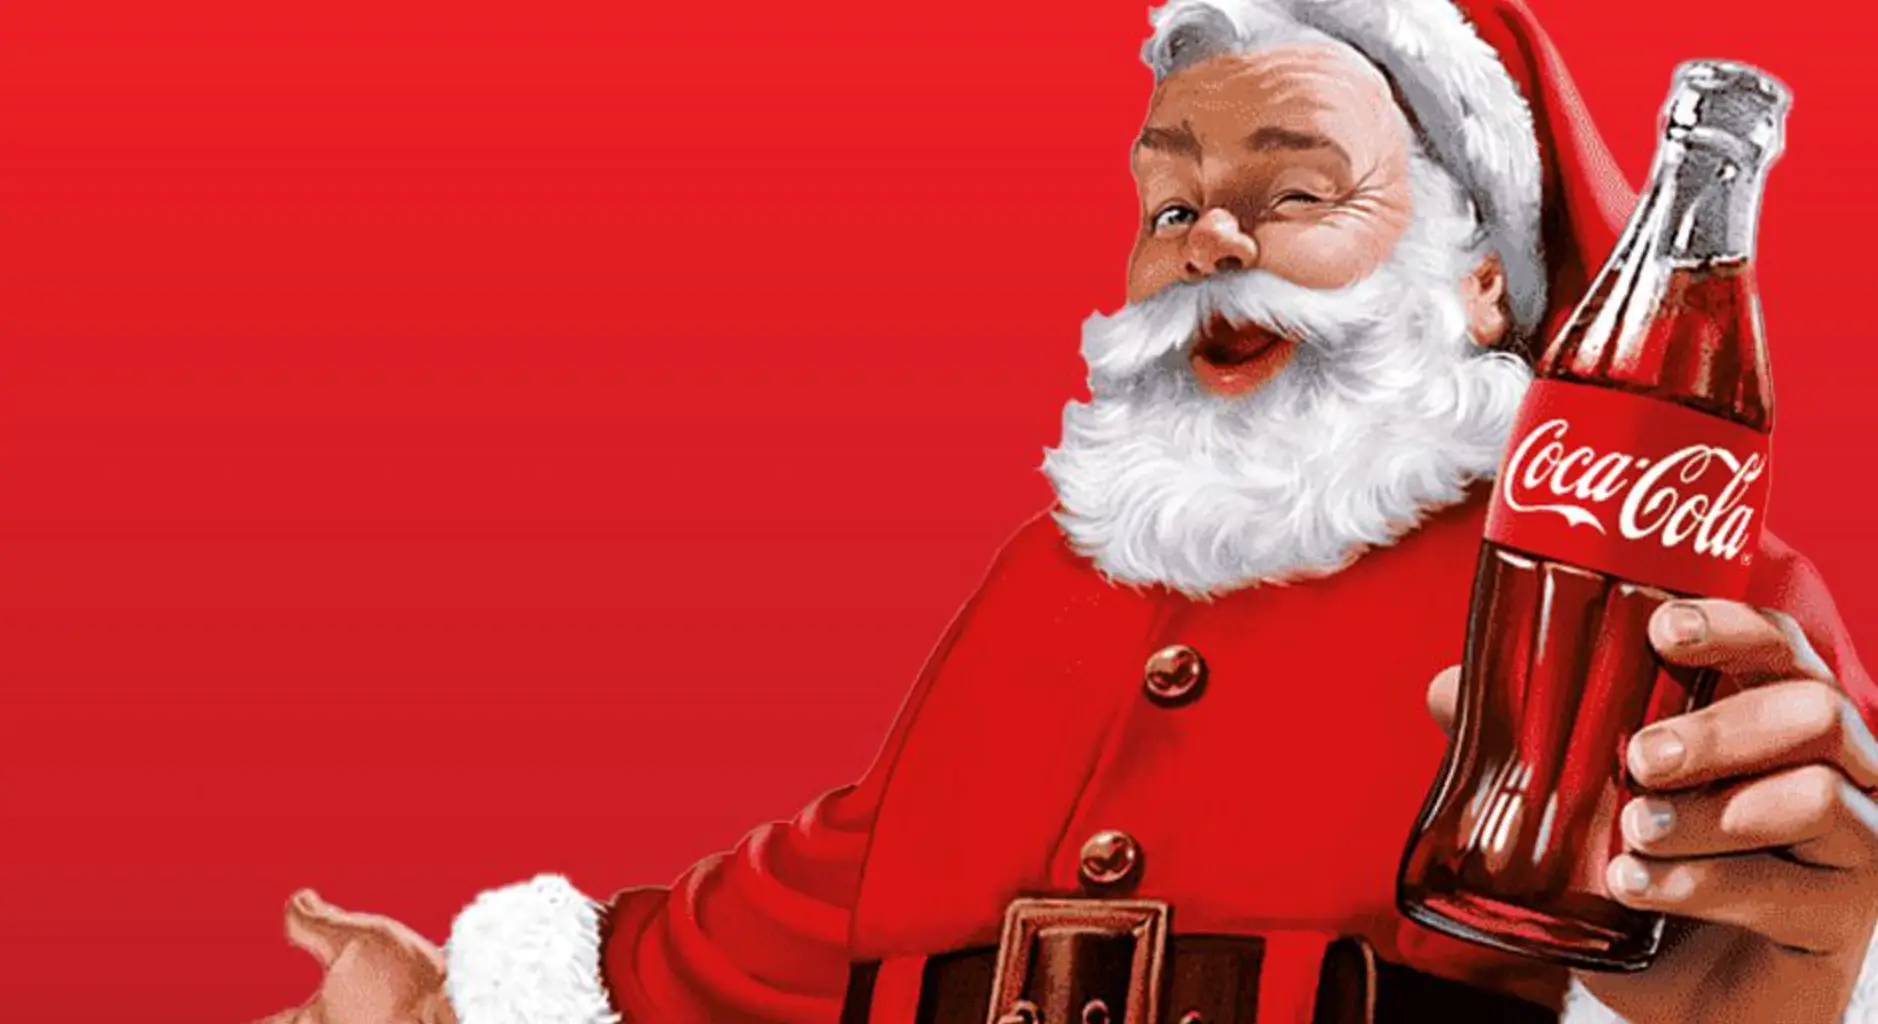
Coca-Cola reported $5.4 billion in advertising costs in 2025. Its broader growth strategy has also described a major shift toward digital media, with digital representing about 65% of media spend in 2024 compared with less than 30% in 2019 (Coca-Cola Investor Relations). The useful lesson is the combination of distinctive brand assets with a changing channel mix rather than a single fixed media formula.
PepsiCo: multiple categories and different spending definitions
PepsiCo reported $3.4 billion in advertising expense for 2025 and $5.4 billion when advertising and other marketing activities are combined. The distinction is important because broader marketing totals can include work that another company reports outside its advertising line. Older industry coverage remains useful historical context (Dentsu), but it should not be treated as a current audited ranking.
The company also has to coordinate messaging across drinks, snacks, sports beverages, and many regional brands. Brand Vision’s review of the PepsiCo corporate rebrand shows the related brand-architecture challenge: the parent needs to be visible without making every portfolio brand look the same.
Nestlé: portfolio breadth makes continuous support understandable
Nestlé’s portfolio spans coffee, pet care, confectionery, prepared foods, nutrition, and other categories. That breadth explains why the group has historically appeared in lists of large advertisers (Dentsu). The important caveat is timing: this source is useful historical context, not proof of Nestlé’s exact current position in a 2025 or 2026 global ranking.
For large consumer portfolios, paid media is only one layer. Distribution, shelf presence, retailer media, packaging, promotions, and brand memory all influence how often a company appears to consumers.

Samsung and Apple: launch visibility is not the same as annual rank
Device brands such as Samsung and Apple are highly visible around product launches, retail resets, carrier promotions, outdoor media, video, and creator reviews. That makes them useful examples of burst-based advertising, but the existing global-ad-market coverage does not establish an audited spend ranking for the two companies (Marketing Week).
The practical lesson is channel concentration. A product launch can justify high-impact reach for a limited period, while paid media campaigns closer to conversion can capture demand after awareness has already been created.
Toyota, Volkswagen Group and GM: high-consideration categories need long journeys
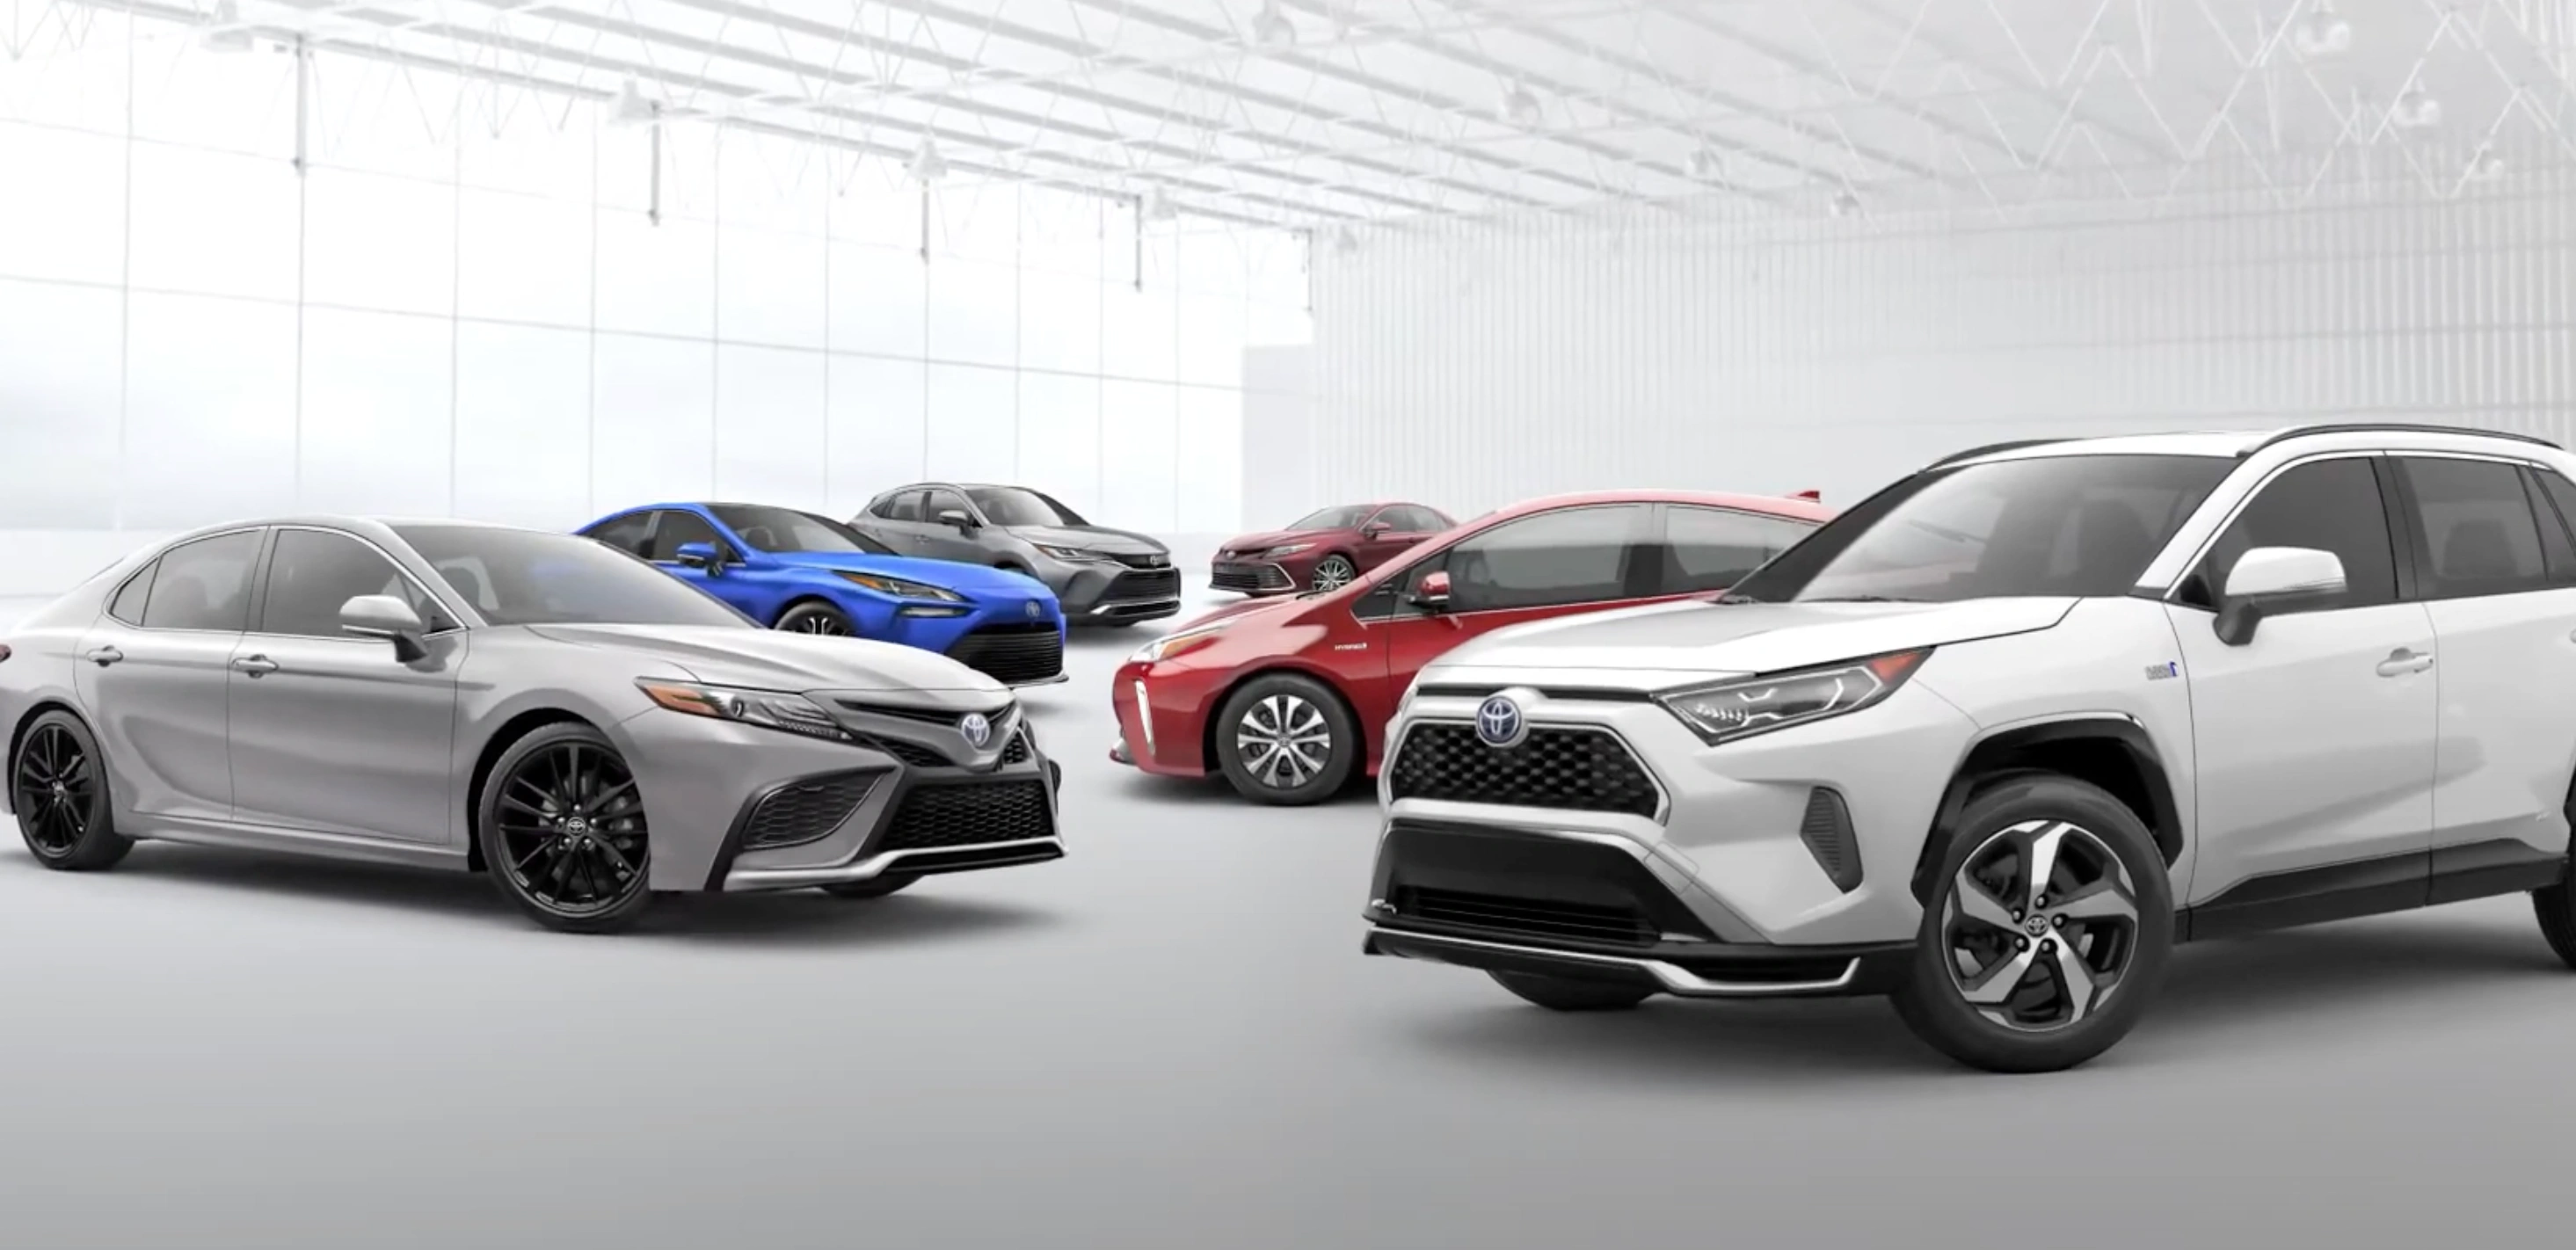
Automotive advertising operates differently from packaged goods. Purchases are infrequent, expensive, locally fulfilled, and often researched over weeks or months. That encourages a mix of broad-reach media, search, maps, dealer advertising, comparison tools, and launch campaigns. It is reasonable to describe automotive as an advertising-intensive category, but not to declare these three companies a precise global spend rank without comparable disclosures.
This is also where measurement discipline matters. A lead-generation campaign may look efficient while the actual vehicle-sale economics tell a different story. The same distinction is covered in Brand Vision’s guide to CPL versus CPA.
Disney, Comcast and Netflix: content companies advertise and sell attention
Studios and streaming companies constantly rotate new films, series, sports, bundles, and subscription tiers. At the same time, ad-supported streaming means several of these businesses increasingly sell advertising inventory as well as buy media to promote their own content. That makes the same buyer-versus-seller distinction important here too (Marketing Week).
Their visibility is structurally high because every major release creates a new marketing window. That still does not make a general global-market article sufficient evidence for an exact company-by-company spending rank.
The platform effect: advertiser spend and platform revenue are different
WARC estimated the global advertising market at $1.19 trillion for 2025 and projected continued growth into 2026. It also estimated that Alphabet, Amazon, and Meta would capture 56.1% of global ad spend excluding China in 2025 (WARC Global Ad Trends) (Marketing Week). That percentage describes money flowing to those companies as media owners, not the amount those companies spend promoting themselves.
For marketers, this concentration increases the value of balancing platform execution with durable brand stories. A branding agency can help clarify what the brand should stand for before paid distribution scales the message.
FAQ
Which company spends the most on advertising worldwide?
There is no single definitive public answer because company disclosures are not standardized. Amazon reported $23.5 billion in advertising and promotional costs for 2025, L’Oréal reported €14.18 billion in advertising and promotion, and P&G reported $9.2 billion in advertising costs, but those line items are not accounting equivalents.
Why can’t media-effectiveness rankings be used as ad-spend rankings?
Effectiveness rankings typically score award performance, strategy, or campaign results. They can show which advertisers produce highly recognized work, but they do not tell you how many dollars or euros the company spent on media.
How does Amazon fit as both advertiser and ad seller?
Amazon spends money promoting retail, Prime, devices, and other services while also earning advertising revenue from sellers, brands, publishers, and video advertisers. In 2025 those were separate disclosures: $23.5 billion in advertising and promotional costs and $68.6 billion in advertising-services revenue.
What should smaller brands learn from the biggest advertisers?
The most transferable lesson is consistency, not budget size. Define the audience and positioning, use recognizable brand assets, select channels for the job they need to do, and compare awareness metrics with downstream acquisition economics before increasing spend.
What global advertisers actually teach us
The most advertised brands are difficult to rank cleanly, but the pattern is clear: large consumer portfolios maintain visibility across many markets, channels, and buying moments. The companies that disclose substantial advertising investment also tend to pair that spend with strong distribution, clear portfolio roles, recognizable assets, and disciplined measurement.
If your business is deciding whether the next constraint is positioning, creative, media, or measurement, talk with Brand Vision before treating a larger media budget as the solution.